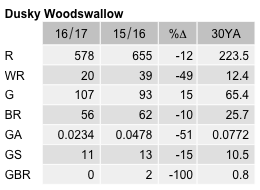
Dusky Woodswallow
Artamus cyanopterus
ABR description
The following is extracted from the Annual Bird Report for the twelve months to June 2017.
Common, breeding summer migrant
A migrant woodland species, some over-winter.
General: 2,937 birds recorded, fewer than last year (3,382) though more than the 10YA (1,902) and the 30YA (1,017). Recorded in every month except Jun, with a far higher proportion of records in spring and summer (both 36%) than in autumn (20%) and winter (7%). While the reporting rate is at its lowest level ever, it is still about half the long-term average. The rate is (4.2%), lower than last year (5.6%), the 10YA (7.4%) and the 30YA (8.2%). Recorded from 35% of grid cells surveyed, similar to last year (31%), the 10YA (32%) and the 30YA (29%). Max 45 (103 last year), mean 5.1, median 3. Abundance (0.2075) lower than last year (0.2890), the 10YA (0.4008) and the 30YA (0.3731). 57 breeding records (62 last year): first ny/26 Aug JWNR (CnM1) and last dy/24 Feb LBath S Morass (LeM1).
GBS: 60 birds recorded, fewer than last year (139), the 10YA (231) and the 30YA (210). Number of records (16) far fewer than last year (34), the 10YA (44) and the 30YA (35). Recorded in Jul, Sep, Oct and Feb to Apr, with a marked autumn peak (75%) and lower proportions in winter (6%), spring (12%) and summer (6%). Records from 19% of sites (the same as last year), similar to the 10YA (19%) and the 30YA (16%). Abundance far lower than last year (0.0478), the 10YA (0.0723) and the 30YA (0.0772). Max 12, mean 3.8, median 3. No breeding records, 2 last year.
Abundance
Abundance is the average number of birds of that species per survey. Where the species was observed (presence recorded) but the number of birds seen was not recorded, this is treated as a count of zero.
Abundance by year
This chart shows the abundance of Dusky Woodswallow between 1982 and 2017. 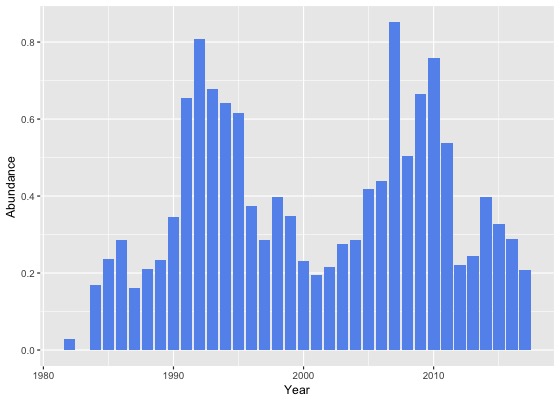
Abundance by month
This chart shows the monthly abundance of Dusky Woodswallow. The blue lines show the abundance for the twelve months to June 2017 and the bars show the average abundance for the period 1982 to 2017. 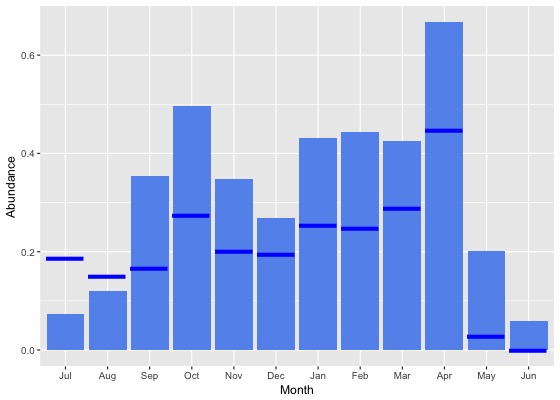
Abundance by season
This chart shows the seasonal abundance of Dusky Woodswallow. The blue lines show the seasonal abundance for the twelve months to June 2017 and the bars show the average seasonal abundance for the period 1982 to 2017. 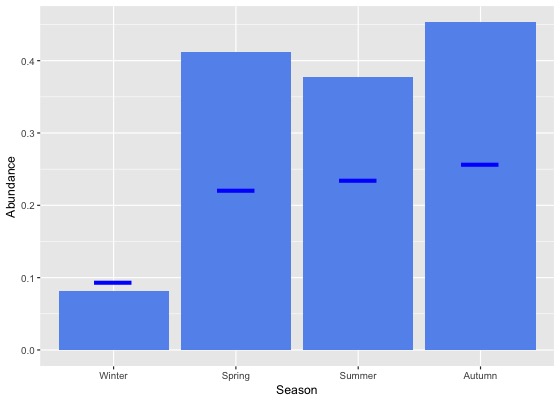
Abundance data
| Month | Season | ||||||||||||||||||
|---|---|---|---|---|---|---|---|---|---|---|---|---|---|---|---|---|---|---|---|
| Period | Jul | Aug | Sep | Oct | Nov | Dec | Jan | Feb | Mar | Apr | May | Jun | Winter | Spring | Summer | Autumn | All | ||
| All years | |||||||||||||||||||
| All | 0.1 | 0.1 | 0.4 | 0.5 | 0.3 | 0.3 | 0.4 | 0.4 | 0.4 | 0.7 | 0.2 | 0.1 | 0.1 | 0.4 | 0.4 | 0.5 | 0.3 | ||
| Previous years | |||||||||||||||||||
| All previous years | 0.1 | 0.1 | 0.4 | 0.5 | 0.4 | 0.3 | 0.5 | 0.5 | 0.5 | 0.7 | 0.2 | 0.1 | 0.1 | 0.4 | 0.4 | 0.5 | 0.4 | ||
| Previous 30 years | 0.1 | 0.1 | 0.4 | 0.5 | 0.4 | 0.3 | 0.5 | 0.5 | 0.5 | 0.7 | 0.2 | 0.1 | 0.1 | 0.4 | 0.4 | 0.5 | 0.4 | ||
| Previous 20 years | 0.1 | 0.1 | 0.4 | 0.5 | 0.4 | 0.3 | 0.5 | 0.5 | 0.4 | 0.7 | 0.3 | 0.1 | 0.1 | 0.4 | 0.4 | 0.5 | 0.4 | ||
| 10 year groups | |||||||||||||||||||
| [2007,2017) | 0.1 | 0.1 | 0.4 | 0.6 | 0.4 | 0.3 | 0.5 | 0.5 | 0.4 | 0.7 | 0.3 | 0.1 | 0.1 | 0.5 | 0.4 | 0.5 | 0.4 | ||
| [1997,2007) | 0.1 | 0.1 | 0.3 | 0.4 | 0.3 | 0.2 | 0.5 | 0.5 | 0.4 | 0.6 | 0.3 | 0.0 | 0.1 | 0.3 | 0.3 | 0.4 | 0.3 | ||
| [1987,1997) | 0.0 | 0.1 | 0.3 | 0.6 | 0.4 | 0.3 | 0.4 | 0.5 | 0.5 | 0.9 | 0.1 | 0.0 | 0.1 | 0.5 | 0.4 | 0.5 | 0.4 | ||
| 5 year groups | |||||||||||||||||||
| [2012,2017) | 0.0 | 0.1 | 0.4 | 0.4 | 0.3 | 0.2 | 0.3 | 0.4 | 0.4 | 0.5 | 0.2 | 0.1 | 0.0 | 0.4 | 0.3 | 0.4 | 0.3 | ||
| [2007,2012) | 0.2 | 0.3 | 0.6 | 0.8 | 0.7 | 0.5 | 1.0 | 1.0 | 0.6 | 1.1 | 0.6 | 0.2 | 0.2 | 0.7 | 0.8 | 0.8 | 0.7 | ||
| [2002,2007) | 0.1 | 0.1 | 0.3 | 0.4 | 0.3 | 0.2 | 0.5 | 0.5 | 0.4 | 0.6 | 0.3 | 0.0 | 0.1 | 0.4 | 0.4 | 0.5 | 0.3 | ||
| [1997,2002) | 0.0 | 0.1 | 0.2 | 0.4 | 0.2 | 0.1 | 0.4 | 0.4 | 0.4 | 0.6 | 0.2 | 0.0 | 0.1 | 0.3 | 0.3 | 0.4 | 0.3 | ||
| [1992,1997) | 0.0 | 0.2 | 0.6 | 1.0 | 0.8 | 0.4 | 0.6 | 0.7 | 0.8 | 1.4 | 0.3 | 0.0 | 0.1 | 0.8 | 0.6 | 0.9 | 0.6 | ||
| [1987,1992) | 0.0 | 0.1 | 0.2 | 0.4 | 0.3 | 0.3 | 0.3 | 0.5 | 0.4 | 0.6 | 0.0 | 0.0 | 0.0 | 0.3 | 0.4 | 0.3 | 0.3 | ||
| Year | |||||||||||||||||||
| 2017 | 0.2 | 0.2 | 0.2 | 0.3 | 0.2 | 0.2 | 0.3 | 0.2 | 0.3 | 0.4 | 0.0 | 0.0 | 0.1 | 0.2 | 0.2 | 0.3 | 0.2 | ||
| 2016 | 0.0 | 0.1 | 0.3 | 0.3 | 0.3 | 0.3 | 0.4 | 0.4 | 0.4 | 0.6 | 0.1 | 0.1 | 0.1 | 0.3 | 0.4 | 0.4 | 0.3 | ||
| 2015 | 0.0 | 0.1 | 0.6 | 0.4 | 0.3 | 0.3 | 0.3 | 0.4 | 0.4 | 0.5 | 0.2 | 0.0 | 0.0 | 0.5 | 0.3 | 0.4 | 0.3 | ||
| 2014 | 0.0 | 0.0 | 0.3 | 0.7 | 0.4 | 0.3 | 0.4 | 0.3 | 0.4 | 0.7 | 0.3 | 0.2 | 0.1 | 0.5 | 0.4 | 0.5 | 0.4 | ||
| 2013 | 0.0 | 0.0 | 0.2 | 0.5 | 0.2 | 0.2 | 0.2 | 0.3 | 0.3 | 0.4 | 0.1 | 0.0 | 0.0 | 0.3 | 0.2 | 0.3 | 0.2 | ||
| 2012 | 0.0 | 0.1 | 0.4 | 0.4 | 0.2 | 0.2 | 0.2 | 0.4 | 0.2 | 0.3 | 0.1 | 0.0 | 0.0 | 0.3 | 0.2 | 0.2 | 0.2 | ||
| 2011 | 0.6 | 0.3 | 0.5 | 1.0 | 0.6 | 0.4 | 0.5 | 0.6 | 0.3 | 1.2 | 0.1 | 0.0 | 0.2 | 0.8 | 0.5 | 0.6 | 0.5 | ||
| 2010 | 0.0 | 0.6 | 0.6 | 0.8 | 0.7 | 0.7 | 0.6 | 1.6 | 0.9 | 1.2 | 1.5 | 0.3 | 0.3 | 0.7 | 0.8 | 1.1 | 0.8 | ||
| 2009 | 0.1 | 0.3 | 0.5 | 0.8 | 0.9 | 0.4 | 1.1 | 0.8 | 1.3 | 0.9 | 0.4 | 0.0 | 0.1 | 0.8 | 0.7 | 0.9 | 0.7 | ||
| 2008 | 0.3 | 0.1 | 0.4 | 0.5 | 0.5 | 0.5 | 1.4 | 1.0 | 0.3 | 0.7 | 0.8 | 0.1 | 0.1 | 0.4 | 0.9 | 0.6 | 0.5 | ||
| 2007 | 0.0 | 0.0 | 1.2 | 0.9 | 0.9 | 0.5 | 1.5 | 1.2 | 0.5 | 1.4 | 1.1 | 0.5 | 0.3 | 1.0 | 1.0 | 1.0 | 0.9 | ||
| 2006 | 0.6 | 0.1 | 0.4 | 0.6 | 0.2 | 0.2 | 0.9 | 0.8 | 0.5 | 0.6 | 0.1 | 0.0 | 0.2 | 0.5 | 0.7 | 0.4 | 0.4 | ||
| 2005 | 0.1 | 0.3 | 0.4 | 0.5 | 0.7 | 0.4 | 0.7 | 0.6 | 0.5 | 0.4 | 0.7 | 0.1 | 0.2 | 0.5 | 0.5 | 0.5 | 0.4 | ||
| 2004 | 0.0 | 0.0 | 0.2 | 0.2 | 0.2 | 0.1 | 0.5 | 0.8 | 0.3 | 1.0 | 0.4 | 0.0 | 0.0 | 0.2 | 0.4 | 0.6 | 0.3 | ||
| 2003 | 0.0 | 0.1 | 0.4 | 0.2 | 0.3 | 0.1 | 0.2 | 0.2 | 0.6 | 0.8 | 0.0 | 0.0 | 0.0 | 0.3 | 0.2 | 0.5 | 0.3 | ||
| 2002 | 0.0 | 0.1 | 0.3 | 0.4 | 0.3 | 0.2 | 0.2 | 0.4 | 0.3 | 0.2 | 0.3 | 0.0 | 0.0 | 0.3 | 0.2 | 0.3 | 0.2 | ||
| 2001 | 0.0 | 0.0 | 0.2 | 0.3 | 0.2 | 0.2 | 0.3 | 0.5 | 0.2 | 0.4 | 0.0 | 0.0 | 0.0 | 0.2 | 0.3 | 0.2 | 0.2 | ||
| 2000 | 0.0 | 0.3 | 0.3 | 0.3 | 0.2 | 0.1 | 0.3 | 0.3 | 0.5 | 0.4 | 0.0 | 0.0 | 0.1 | 0.3 | 0.2 | 0.3 | 0.2 | ||
| 1999 | 0.1 | 0.1 | 0.3 | 0.5 | 0.3 | 0.1 | 0.6 | 0.3 | 0.7 | 0.9 | 0.0 | 0.0 | 0.0 | 0.4 | 0.3 | 0.5 | 0.3 | ||
| 1998 | 0.4 | 0.0 | 0.3 | 0.4 | 0.3 | 0.0 | 0.7 | 0.5 | 0.7 | 0.8 | 1.5 | 0.2 | 0.2 | 0.3 | 0.3 | 0.8 | 0.4 | ||
| 1997 | 0.0 | 0.0 | 0.1 | 0.2 | 0.2 | 0.3 | 0.4 | 0.1 | 0.8 | 0.7 | 1.2 | 0.0 | 0.0 | 0.2 | 0.3 | 0.8 | 0.3 | ||
| 1996 | 0.0 | 0.6 | 0.3 | 0.8 | 0.5 | 0.3 | 0.8 | 0.3 | 0.1 | 0.4 | 0.0 | 0.0 | 0.2 | 0.6 | 0.5 | 0.2 | 0.4 | ||
| 1995 | 0.0 | 0.0 | 0.2 | 0.5 | 1.3 | 0.1 | 0.7 | 1.2 | 1.1 | 2.0 | 0.0 | 0.0 | 0.0 | 0.7 | 0.6 | 1.2 | 0.6 | ||
| 1994 | 0.0 | 0.3 | 1.0 | 1.0 | 0.3 | 0.6 | 0.5 | 0.3 | 0.6 | 2.1 | 0.0 | 0.0 | 0.1 | 0.7 | 0.5 | 1.1 | 0.6 | ||
| 1993 | 0.0 | 0.1 | 0.3 | 0.9 | 1.2 | 0.8 | 0.7 | 0.1 | 1.5 | 1.0 | 1.1 | 0.0 | 0.0 | 0.8 | 0.6 | 1.2 | 0.7 | ||
| 1992 | 0.0 | 0.0 | 1.3 | 2.1 | 1.2 | 0.8 | 0.4 | 1.7 | 0.9 | 0.3 | 0.4 | 0.0 | 0.0 | 1.6 | 0.9 | 0.6 | 0.8 | ||
| 1991 | 0.0 | 0.0 | 0.5 | 0.8 | 1.1 | 0.4 | 1.0 | 1.1 | 2.1 | 1.5 | 0.1 | 0.0 | 0.0 | 0.8 | 0.8 | 1.2 | 0.7 | ||
| 1990 | 0.0 | 0.0 | 0.2 | 0.2 | 0.2 | 0.2 | 0.6 | 0.6 | 0.6 | 2.2 | 0.1 | 0.0 | 0.0 | 0.2 | 0.5 | 1.0 | 0.3 | ||
| 1989 | 0.0 | 0.2 | 0.3 | 0.5 | 0.2 | 0.3 | 0.3 | 0.6 | 0.1 | 0.2 | 0.0 | 0.0 | 0.1 | 0.3 | 0.4 | 0.1 | 0.2 | ||
| 1988 | 0.0 | 0.1 | 0.2 | 0.3 | 0.2 | 0.3 | 0.2 | 0.4 | 0.2 | 0.6 | 0.0 | 0.0 | 0.0 | 0.2 | 0.3 | 0.3 | 0.2 | ||
| 1987 | 0.0 | 0.0 | 0.1 | 0.2 | 0.2 | 0.3 | 0.2 | 0.3 | 0.2 | 0.1 | 0.0 | 0.0 | 0.0 | 0.2 | 0.3 | 0.1 | 0.2 | ||
| 1986 | 0.0 | 0.0 | 0.2 | 0.5 | 0.2 | 0.1 | 0.1 | 0.6 | 0.0 | 0.7 | 0.8 | 0.0 | 0.0 | 0.3 | 0.3 | 0.5 | 0.3 | ||
| 1985 | 0.0 | 0.0 | 0.1 | 0.4 | 0.4 | 0.2 | 0.0 | 0.7 | 0.0 | 0.4 | 0.0 | 0.0 | 0.0 | 0.3 | 0.3 | 0.2 | 0.2 | ||
| 1984 | 0.0 | 0.0 | 0.0 | 0.0 | 0.0 | 0.0 | 0.6 | 0.6 | 0.0 | 0.1 | 0.0 | 0.0 | 0.0 | 0.0 | 0.5 | 0.0 | 0.2 | ||
| 1983 | 0.0 | 0.0 | 0.0 | 0.0 | 0.0 | 0.0 | 0.0 | 0.0 | 0.0 | - | 0.0 | 0.0 | 0.0 | 0.0 | 0.0 | 0.0 | 0.0 | ||
| 1982 | - | 0.0 | - | 0.0 | 0.0 | 0.0 | - | 0.0 | - | 0.2 | - | 0.0 | 0.0 | 0.0 | 0.0 | 0.2 | 0.0 | ||
Reporting rates
Reporting rate is the proportion of all surveys in which the species was present.
Reporting rate by year
This chart shows the reporting rate of Dusky Woodswallow each year between 1982 and 2017. 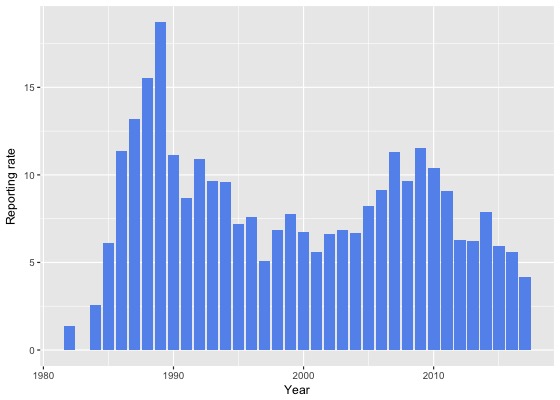
Reporting rate by month
This chart shows the reporting rate by month of Dusky Woodswallow. The blue lines show the reporting rate for the twelve months to June 2017 and the bars show the average reporting rate for the period 1982 to 2017. 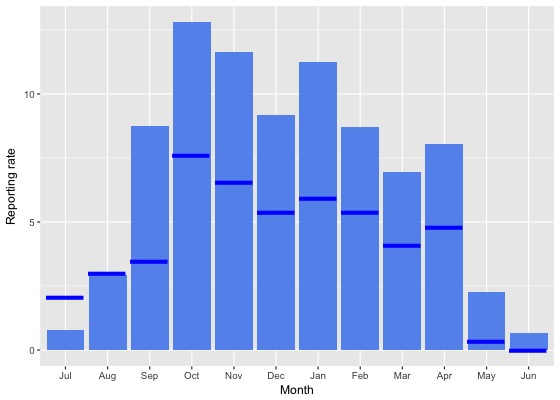
Reporting rate by season
This chart shows the seasonal reporting rate of Dusky Woodswallow. The blue lines show the seasonal reporting rate for the twelve months to June 2017 and the bars show the average seasonal reporting rate for the period 1982 to 2017. 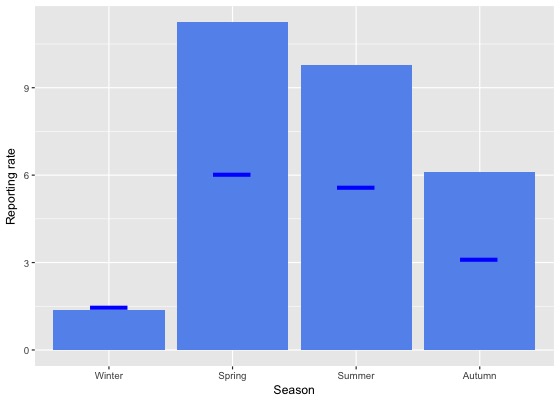
Reporting rate data
| Month | Season | ||||||||||||||||||
|---|---|---|---|---|---|---|---|---|---|---|---|---|---|---|---|---|---|---|---|
| Period | Jul | Aug | Sep | Oct | Nov | Dec | Jan | Feb | Mar | Apr | May | Jun | Winter | Spring | Summer | Autumn | All | ||
| All years | |||||||||||||||||||
| All | 0.8 | 2.9 | 8.8 | 12.8 | 11.6 | 9.2 | 11.2 | 8.7 | 7.0 | 8.0 | 2.3 | 0.7 | 1.4 | 11.2 | 9.8 | 6.1 | 7.6 | ||
| Previous years | |||||||||||||||||||
| All previous years | 0.6 | 2.9 | 9.5 | 13.5 | 12.5 | 9.7 | 12.2 | 9.4 | 7.5 | 8.6 | 2.7 | 0.8 | 1.4 | 12.0 | 10.5 | 6.7 | 8.2 | ||
| Previous 30 years | 0.6 | 3.0 | 9.5 | 13.5 | 12.4 | 9.8 | 12.3 | 9.5 | 7.5 | 8.5 | 2.7 | 0.8 | 1.4 | 12.0 | 10.6 | 6.7 | 8.2 | ||
| Previous 20 years | 0.7 | 2.1 | 8.4 | 12.4 | 10.7 | 8.1 | 11.0 | 7.9 | 6.2 | 7.7 | 2.7 | 0.9 | 1.2 | 10.7 | 9.1 | 5.9 | 7.3 | ||
| 10 year groups | |||||||||||||||||||
| [2007,2017) | 0.5 | 2.0 | 8.5 | 12.2 | 10.7 | 8.3 | 10.9 | 7.4 | 6.1 | 7.6 | 2.9 | 1.0 | 1.2 | 10.8 | 9.1 | 5.9 | 7.4 | ||
| [1997,2007) | 1.0 | 2.3 | 8.0 | 13.3 | 10.8 | 7.6 | 11.3 | 9.1 | 6.5 | 7.8 | 2.4 | 0.6 | 1.2 | 10.6 | 9.1 | 6.0 | 7.1 | ||
| [1987,1997) | 0.1 | 5.5 | 15.5 | 19.9 | 18.0 | 19.6 | 19.8 | 16.9 | 14.9 | 13.0 | 2.6 | 0.3 | 2.1 | 18.0 | 18.8 | 10.4 | 12.6 | ||
| 5 year groups | |||||||||||||||||||
| [2012,2017) | 0.0 | 1.3 | 7.7 | 10.5 | 8.5 | 7.8 | 9.5 | 5.8 | 5.5 | 6.3 | 1.6 | 0.7 | 0.7 | 9.2 | 7.9 | 4.8 | 6.2 | ||
| [2007,2012) | 2.0 | 4.5 | 10.4 | 15.1 | 16.9 | 9.4 | 15.9 | 14.2 | 7.8 | 10.7 | 6.5 | 1.7 | 2.4 | 14.1 | 12.7 | 8.7 | 10.3 | ||
| [2002,2007) | 1.0 | 2.7 | 8.9 | 14.2 | 12.4 | 8.4 | 12.1 | 9.4 | 6.4 | 8.2 | 3.0 | 0.6 | 1.2 | 11.8 | 9.7 | 6.2 | 7.6 | ||
| [1997,2002) | 1.2 | 1.7 | 7.1 | 11.9 | 8.9 | 6.6 | 10.5 | 8.7 | 6.6 | 7.4 | 1.5 | 0.5 | 1.1 | 9.1 | 8.4 | 5.6 | 6.4 | ||
| [1992,1997) | 0.0 | 3.9 | 10.4 | 15.4 | 15.4 | 10.9 | 12.3 | 9.0 | 11.6 | 8.2 | 2.7 | 0.0 | 1.5 | 14.0 | 10.9 | 7.8 | 8.8 | ||
| [1987,1992) | 0.1 | 6.4 | 17.9 | 22.4 | 19.2 | 23.4 | 23.9 | 20.0 | 16.8 | 15.8 | 2.5 | 0.4 | 2.5 | 19.9 | 22.5 | 11.9 | 14.6 | ||
| Year | |||||||||||||||||||
| 2017 | 2.0 | 3.0 | 3.5 | 7.6 | 6.5 | 5.4 | 5.9 | 5.4 | 4.1 | 4.8 | 0.3 | 0.0 | 1.5 | 6.0 | 5.6 | 3.1 | 4.2 | ||
| 2016 | 0.0 | 1.6 | 7.0 | 8.3 | 7.4 | 6.9 | 9.3 | 5.4 | 6.4 | 6.2 | 1.4 | 1.6 | 1.1 | 7.7 | 7.3 | 5.0 | 5.6 | ||
| 2015 | 0.0 | 1.8 | 9.3 | 11.1 | 7.6 | 7.6 | 8.0 | 5.2 | 5.5 | 6.5 | 1.6 | 0.0 | 0.5 | 9.5 | 7.1 | 4.8 | 5.9 | ||
| 2014 | 0.0 | 1.3 | 7.0 | 14.0 | 12.6 | 8.1 | 13.4 | 6.8 | 5.9 | 6.6 | 2.6 | 1.3 | 1.0 | 11.6 | 10.4 | 5.4 | 7.9 | ||
| 2013 | 0.0 | 0.0 | 5.5 | 12.9 | 9.0 | 8.1 | 8.7 | 5.0 | 3.4 | 6.3 | 2.1 | 0.0 | 0.0 | 9.7 | 7.6 | 4.2 | 6.2 | ||
| 2012 | 0.0 | 0.8 | 9.3 | 9.0 | 8.7 | 9.7 | 8.1 | 9.3 | 4.5 | 5.5 | 1.1 | 0.0 | 0.2 | 9.0 | 8.8 | 4.2 | 6.3 | ||
| 2011 | 4.9 | 4.0 | 8.9 | 19.6 | 15.2 | 6.5 | 12.7 | 9.6 | 3.4 | 11.6 | 4.0 | 0.0 | 1.9 | 15.8 | 9.6 | 6.5 | 9.1 | ||
| 2010 | 0.0 | 7.0 | 10.9 | 13.1 | 12.9 | 9.1 | 15.9 | 14.1 | 7.9 | 14.5 | 9.8 | 3.1 | 3.4 | 12.4 | 12.3 | 10.8 | 10.4 | ||
| 2009 | 1.4 | 8.3 | 10.5 | 15.3 | 17.9 | 10.6 | 18.0 | 20.0 | 14.0 | 9.4 | 6.1 | 0.0 | 2.2 | 14.6 | 15.5 | 10.3 | 11.5 | ||
| 2008 | 2.8 | 1.7 | 11.2 | 11.3 | 15.4 | 12.2 | 27.8 | 13.9 | 7.0 | 6.8 | 6.3 | 0.9 | 1.7 | 11.9 | 16.9 | 6.8 | 9.7 | ||
| 2007 | 0.0 | 1.9 | 10.4 | 16.7 | 24.3 | 10.1 | 13.0 | 17.4 | 8.5 | 12.4 | 9.8 | 4.2 | 3.0 | 16.2 | 12.4 | 10.3 | 11.3 | ||
| 2006 | 1.3 | 4.9 | 10.1 | 16.6 | 9.5 | 10.1 | 19.7 | 14.8 | 6.5 | 8.6 | 2.2 | 0.0 | 1.4 | 13.2 | 14.8 | 6.2 | 9.2 | ||
| 2005 | 3.7 | 7.5 | 8.6 | 16.0 | 16.6 | 10.8 | 12.1 | 10.9 | 6.9 | 6.0 | 3.5 | 1.5 | 3.4 | 12.8 | 11.2 | 5.5 | 8.2 | ||
| 2004 | 0.0 | 0.7 | 6.2 | 11.0 | 12.8 | 5.5 | 12.1 | 13.1 | 4.7 | 12.1 | 5.8 | 1.2 | 0.5 | 9.8 | 9.4 | 7.7 | 6.7 | ||
| 2003 | 0.9 | 1.4 | 11.0 | 12.4 | 13.8 | 7.2 | 7.4 | 3.3 | 6.7 | 8.3 | 0.8 | 0.0 | 0.7 | 12.4 | 6.0 | 6.0 | 6.9 | ||
| 2002 | 0.0 | 0.8 | 8.0 | 12.4 | 10.0 | 8.6 | 7.5 | 8.6 | 6.8 | 6.0 | 3.5 | 0.0 | 0.2 | 10.3 | 8.3 | 5.9 | 6.6 | ||
| 2001 | 0.9 | 0.0 | 4.7 | 12.6 | 10.8 | 9.4 | 8.5 | 11.3 | 3.3 | 3.9 | 0.6 | 0.0 | 0.3 | 8.7 | 9.7 | 2.8 | 5.6 | ||
| 2000 | 0.8 | 3.9 | 7.4 | 12.3 | 9.7 | 5.0 | 8.3 | 8.1 | 8.6 | 8.4 | 0.0 | 0.5 | 1.7 | 9.9 | 6.9 | 6.9 | 6.7 | ||
| 1999 | 2.9 | 3.1 | 11.5 | 15.7 | 8.4 | 6.9 | 12.4 | 7.9 | 8.1 | 10.8 | 1.7 | 0.9 | 1.7 | 11.9 | 8.9 | 7.0 | 7.8 | ||
| 1998 | 5.4 | 0.0 | 8.9 | 5.4 | 8.0 | 1.9 | 20.6 | 9.4 | 7.5 | 7.7 | 3.7 | 1.3 | 1.8 | 7.6 | 9.3 | 6.9 | 6.8 | ||
| 1997 | 0.0 | 0.0 | 4.5 | 7.9 | 6.0 | 7.7 | 9.8 | 3.5 | 12.5 | 5.5 | 6.7 | 0.0 | 0.0 | 5.9 | 7.1 | 7.2 | 5.1 | ||
| 1996 | 0.0 | 10.6 | 6.7 | 16.7 | 9.3 | 10.1 | 11.7 | 4.7 | 6.9 | 3.1 | 1.7 | 0.0 | 4.0 | 11.4 | 9.1 | 4.5 | 7.6 | ||
| 1995 | 0.0 | 1.6 | 8.7 | 9.1 | 10.0 | 4.6 | 12.4 | 14.3 | 13.3 | 8.9 | 2.6 | 0.0 | 0.6 | 9.3 | 10.3 | 8.7 | 7.2 | ||
| 1994 | 0.0 | 3.9 | 17.6 | 22.1 | 16.2 | 17.4 | 10.3 | 3.4 | 9.1 | 9.9 | 0.0 | 0.0 | 1.4 | 18.3 | 9.9 | 7.0 | 9.6 | ||
| 1993 | 0.0 | 2.6 | 3.2 | 18.7 | 19.7 | 19.6 | 16.3 | 6.2 | 13.6 | 11.7 | 5.2 | 0.0 | 1.0 | 14.3 | 15.0 | 10.1 | 9.7 | ||
| 1992 | 0.0 | 0.0 | 15.3 | 16.0 | 27.8 | 9.5 | 12.1 | 19.5 | 16.9 | 5.1 | 3.9 | 0.0 | 0.0 | 19.1 | 13.0 | 8.7 | 10.9 | ||
| 1991 | 0.0 | 0.0 | 9.3 | 10.7 | 17.5 | 9.5 | 12.5 | 14.0 | 20.6 | 13.6 | 3.3 | 0.0 | 0.0 | 12.6 | 11.7 | 12.6 | 8.7 | ||
| 1990 | 0.0 | 3.2 | 17.2 | 16.3 | 18.7 | 22.2 | 26.4 | 11.3 | 14.8 | 16.7 | 4.1 | 0.0 | 1.4 | 17.4 | 20.0 | 12.2 | 11.2 | ||
| 1989 | 0.5 | 12.5 | 25.3 | 32.3 | 23.7 | 28.7 | 27.7 | 26.8 | 13.9 | 19.5 | 0.7 | 0.0 | 5.0 | 27.5 | 27.8 | 12.1 | 18.7 | ||
| 1988 | 0.0 | 6.0 | 18.5 | 25.0 | 21.1 | 27.2 | 24.6 | 27.4 | 20.8 | 17.1 | 2.0 | 0.0 | 2.3 | 21.9 | 26.4 | 13.3 | 15.5 | ||
| 1987 | 0.0 | 0.0 | 13.8 | 16.8 | 15.5 | 19.4 | 22.1 | 12.9 | 15.3 | 11.9 | 3.5 | 1.5 | 1.3 | 15.4 | 17.8 | 10.1 | 13.2 | ||
| 1986 | 0.0 | 2.6 | 13.2 | 22.2 | 25.5 | 11.8 | 8.7 | 8.3 | 3.2 | 15.7 | 13.8 | 0.0 | 1.0 | 19.9 | 9.7 | 11.7 | 11.4 | ||
| 1985 | 0.0 | 0.0 | 3.8 | 9.3 | 12.3 | 6.7 | 0.0 | 11.8 | 0.0 | 10.5 | 0.0 | 0.0 | 0.0 | 8.7 | 7.1 | 5.0 | 6.1 | ||
| 1984 | 0.0 | 0.0 | 0.0 | 0.0 | 0.0 | 0.0 | 6.9 | 6.1 | 3.7 | 2.9 | 0.0 | 0.0 | 0.0 | 0.0 | 5.4 | 2.2 | 2.5 | ||
| 1983 | 0.0 | 0.0 | 0.0 | 0.0 | 0.0 | 0.0 | 0.0 | 0.0 | 0.0 | - | 0.0 | 0.0 | 0.0 | 0.0 | 0.0 | 0.0 | 0.0 | ||
| 1982 | - | 0.0 | - | 0.0 | 0.0 | 0.0 | - | 0.0 | - | 7.7 | - | 0.0 | 0.0 | 0.0 | 0.0 | 7.7 | 1.4 | ||
Breeding data
Breeding records by month
Number of breeding records by breeding code and month, 2017 and all years| Breeding code | Jul | Aug | Sep | Oct | Nov | Dec | Jan | Feb | Mar | Apr | May | Jun |
|---|---|---|---|---|---|---|---|---|---|---|---|---|
| 2017 | ||||||||||||
| Breeding (BLA code) | 0 | 0 | 0 | 0 | 0 | 0 | 0 | 0 | 0 | 0 | 0 | 0 |
| Carrying Food | 0 | 0 | 0 | 0 | 1 | 0 | 0 | 0 | 0 | 0 | 0 | 0 |
| Copulating | 0 | 0 | 0 | 0 | 0 | 0 | 0 | 0 | 0 | 0 | 0 | 0 |
| Display | 0 | 0 | 0 | 1 | 2 | 0 | 0 | 0 | 0 | 0 | 0 | 0 |
| Dependent young | 0 | 0 | 0 | 1 | 1 | 7 | 10 | 9 | 0 | 0 | 0 | 0 |
| Faecal sac | 0 | 0 | 0 | 0 | 0 | 0 | 0 | 0 | 0 | 0 | 0 | 0 |
| Inspecting hollow | 0 | 0 | 0 | 1 | 0 | 0 | 0 | 0 | 0 | 0 | 0 | 0 |
| Nest building | 0 | 0 | 0 | 3 | 2 | 0 | 0 | 0 | 0 | 0 | 0 | 0 |
| Nest with eggs | 0 | 0 | 0 | 0 | 0 | 0 | 3 | 0 | 0 | 0 | 0 | 0 |
| Nest with young | 0 | 1 | 0 | 0 | 0 | 3 | 2 | 0 | 0 | 0 | 0 | 0 |
| On/leaving nest | 0 | 0 | 0 | 2 | 5 | 1 | 2 | 0 | 0 | 0 | 0 | 0 |
| All years | ||||||||||||
| Breeding (BLA code) | 0 | 0 | 0 | 3 | 0 | 1 | 16 | 4 | 0 | 0 | 0 | 0 |
| Carrying Food | 0 | 0 | 0 | 6 | 9 | 4 | 1 | 0 | 0 | 0 | 0 | 0 |
| Copulating | 0 | 0 | 1 | 6 | 2 | 1 | 0 | 0 | 0 | 0 | 0 | 0 |
| Display | 0 | 0 | 0 | 2 | 2 | 1 | 0 | 0 | 0 | 1 | 0 | 0 |
| Dependent young | 0 | 0 | 0 | 8 | 44 | 79 | 126 | 87 | 15 | 0 | 0 | 0 |
| Faecal sac | 0 | 0 | 0 | 0 | 0 | 0 | 0 | 0 | 0 | 0 | 0 | 0 |
| Inspecting hollow | 0 | 0 | 0 | 1 | 0 | 0 | 0 | 0 | 0 | 0 | 0 | 0 |
| Nest building | 0 | 0 | 12 | 71 | 29 | 15 | 6 | 2 | 1 | 0 | 0 | 0 |
| Nest with eggs | 0 | 0 | 1 | 19 | 17 | 9 | 6 | 0 | 0 | 0 | 0 | 0 |
| Nest with young | 0 | 1 | 2 | 10 | 23 | 22 | 22 | 2 | 0 | 0 | 0 | 0 |
| On/leaving nest | 0 | 0 | 2 | 54 | 53 | 23 | 11 | 0 | 0 | 0 | 0 | 0 |
Breeding records by year
Average number of breeding records per period by breeding code| Period | Breeding (BLA code) | Carrying Food | Copulating | Display | Dependent young | Faecal sac | Inspecting hollow | Nest building | Nest with eggs | Nest with young | On/leaving nest |
|---|---|---|---|---|---|---|---|---|---|---|---|
| All years | |||||||||||
| All | 0.7 | 0.6 | 0.3 | 0.2 | 10.0 | 0.0 | 0.0 | 3.8 | 1.4 | 2.3 | 4.0 |
| Previous years | |||||||||||
| All previous years | 0.7 | 0.5 | 0.3 | 0.1 | 9.5 | 0.0 | 0.0 | 3.7 | 1.4 | 2.2 | 3.8 |
| Previous 30 years | 0.8 | 0.6 | 0.3 | 0.1 | 11.0 | 0.0 | 0.0 | 4.3 | 1.6 | 2.5 | 4.4 |
| Previous 20 years | 1.2 | 0.6 | 0.5 | 0.1 | 10.8 | 0.0 | 0.0 | 4.2 | 0.3 | 2.4 | 6.0 |
| 10 year groups | |||||||||||
| [2007,2017) | 1.8 | 0.7 | 0.7 | 0.2 | 16.4 | 0.0 | 0.0 | 5.6 | 0.6 | 3.8 | 8.9 |
| [1997,2007) | 0.6 | 0.4 | 0.3 | 0.1 | 5.1 | 0.0 | 0.0 | 2.7 | 0.0 | 0.9 | 3.0 |
| [1987,1997) | 0.0 | 0.8 | 0.0 | 0.0 | 11.4 | 0.0 | 0.0 | 4.6 | 4.3 | 2.9 | 1.4 |
| 5 year groups | |||||||||||
| [2012,2017) | 1.2 | 0.6 | 0.8 | 0.0 | 19.4 | 0.0 | 0.0 | 5.6 | 0.6 | 3.4 | 11.4 |
| [2007,2012) | 2.4 | 0.8 | 0.6 | 0.4 | 13.4 | 0.0 | 0.0 | 5.6 | 0.6 | 4.2 | 6.4 |
| [2002,2007) | 0.8 | 0.6 | 0.4 | 0.0 | 7.6 | 0.0 | 0.0 | 3.2 | 0.0 | 1.2 | 5.2 |
| [1997,2002) | 0.4 | 0.2 | 0.2 | 0.2 | 2.6 | 0.0 | 0.0 | 2.2 | 0.0 | 0.6 | 0.8 |
| [1992,1997) | 0.0 | 0.0 | 0.0 | 0.0 | 4.2 | 0.0 | 0.0 | 1.0 | 0.8 | 0.6 | 2.4 |
| [1987,1992) | 0.0 | 1.6 | 0.0 | 0.0 | 18.6 | 0.0 | 0.0 | 8.2 | 7.8 | 5.2 | 0.4 |
| Year | |||||||||||
| 2017 | 0.0 | 1.0 | 0.0 | 3.0 | 28.0 | 0.0 | 1.0 | 5.0 | 3.0 | 6.0 | 10.0 |
| 2016 | 0.0 | 1.0 | 1.0 | 0.0 | 25.0 | 0.0 | 0.0 | 2.0 | 2.0 | 8.0 | 23.0 |
| 2015 | 0.0 | 0.0 | 0.0 | 0.0 | 28.0 | 0.0 | 0.0 | 14.0 | 0.0 | 6.0 | 16.0 |
| 2014 | 2.0 | 1.0 | 1.0 | 0.0 | 26.0 | 0.0 | 0.0 | 7.0 | 0.0 | 2.0 | 7.0 |
| 2013 | 0.0 | 1.0 | 1.0 | 0.0 | 8.0 | 0.0 | 0.0 | 4.0 | 0.0 | 0.0 | 8.0 |
| 2012 | 4.0 | 0.0 | 1.0 | 0.0 | 10.0 | 0.0 | 0.0 | 1.0 | 1.0 | 1.0 | 3.0 |
| 2011 | 3.0 | 2.0 | 0.0 | 0.0 | 12.0 | 0.0 | 0.0 | 4.0 | 0.0 | 3.0 | 8.0 |
| 2010 | 1.0 | 1.0 | 1.0 | 0.0 | 18.0 | 0.0 | 0.0 | 11.0 | 2.0 | 5.0 | 3.0 |
| 2009 | 3.0 | 0.0 | 1.0 | 2.0 | 8.0 | 0.0 | 0.0 | 6.0 | 0.0 | 2.0 | 6.0 |
| 2008 | 1.0 | 1.0 | 1.0 | 0.0 | 12.0 | 0.0 | 0.0 | 4.0 | 1.0 | 6.0 | 9.0 |
| 2007 | 4.0 | 0.0 | 0.0 | 0.0 | 17.0 | 0.0 | 0.0 | 3.0 | 0.0 | 5.0 | 6.0 |
| 2006 | 4.0 | 1.0 | 0.0 | 0.0 | 12.0 | 0.0 | 0.0 | 6.0 | 0.0 | 4.0 | 15.0 |
| 2005 | 0.0 | 2.0 | 1.0 | 0.0 | 13.0 | 0.0 | 0.0 | 3.0 | 0.0 | 1.0 | 8.0 |
| 2004 | 0.0 | 0.0 | 0.0 | 0.0 | 10.0 | 0.0 | 0.0 | 4.0 | 0.0 | 0.0 | 2.0 |
| 2003 | 0.0 | 0.0 | 1.0 | 0.0 | 2.0 | 0.0 | 0.0 | 1.0 | 0.0 | 1.0 | 1.0 |
| 2002 | 0.0 | 0.0 | 0.0 | 0.0 | 1.0 | 0.0 | 0.0 | 2.0 | 0.0 | 0.0 | 0.0 |
| 2001 | 2.0 | 0.0 | 0.0 | 0.0 | 5.0 | 0.0 | 0.0 | 2.0 | 0.0 | 0.0 | 1.0 |
| 2000 | 0.0 | 1.0 | 1.0 | 0.0 | 2.0 | 0.0 | 0.0 | 3.0 | 0.0 | 1.0 | 0.0 |
| 1999 | 0.0 | 0.0 | 0.0 | 1.0 | 2.0 | 0.0 | 0.0 | 6.0 | 0.0 | 0.0 | 0.0 |
| 1998 | 0.0 | 0.0 | 0.0 | 0.0 | 2.0 | 0.0 | 0.0 | 0.0 | 0.0 | 0.0 | 2.0 |
| 1997 | 0.0 | 0.0 | 0.0 | 0.0 | 2.0 | 0.0 | 0.0 | 0.0 | 0.0 | 2.0 | 1.0 |
| 1996 | 0.0 | 0.0 | 0.0 | 0.0 | 4.0 | 0.0 | 0.0 | 0.0 | 1.0 | 1.0 | 1.0 |
| 1995 | 0.0 | 0.0 | 0.0 | 0.0 | 7.0 | 0.0 | 0.0 | 0.0 | 0.0 | 1.0 | 2.0 |
| 1994 | 0.0 | 0.0 | 0.0 | 0.0 | 5.0 | 0.0 | 0.0 | 1.0 | 0.0 | 0.0 | 3.0 |
| 1993 | 0.0 | 0.0 | 0.0 | 0.0 | 2.0 | 0.0 | 0.0 | 0.0 | 0.0 | 0.0 | 4.0 |
| 1992 | 0.0 | 0.0 | 0.0 | 0.0 | 3.0 | 0.0 | 0.0 | 4.0 | 3.0 | 1.0 | 2.0 |
| 1991 | 0.0 | 0.0 | 0.0 | 0.0 | 4.0 | 0.0 | 0.0 | 2.0 | 1.0 | 1.0 | 0.0 |
| 1990 | 0.0 | 0.0 | 0.0 | 0.0 | 13.0 | 0.0 | 0.0 | 3.0 | 4.0 | 4.0 | 0.0 |
| 1989 | 0.0 | 5.0 | 0.0 | 0.0 | 26.0 | 0.0 | 0.0 | 15.0 | 12.0 | 8.0 | 0.0 |
| 1988 | 0.0 | 2.0 | 0.0 | 0.0 | 34.0 | 0.0 | 0.0 | 14.0 | 12.0 | 7.0 | 2.0 |
| 1987 | 0.0 | 1.0 | 0.0 | 0.0 | 16.0 | 0.0 | 0.0 | 7.0 | 10.0 | 6.0 | 0.0 |
| 1986 | 0.0 | 0.0 | 0.0 | 0.0 | 0.0 | 0.0 | 0.0 | 2.0 | 0.0 | 0.0 | 0.0 |
| 1985 | 0.0 | 0.0 | 0.0 | 0.0 | 0.0 | 0.0 | 0.0 | 0.0 | 0.0 | 0.0 | 0.0 |
| 1984 | 0.0 | 0.0 | 0.0 | 0.0 | 2.0 | 0.0 | 0.0 | 0.0 | 0.0 | 0.0 | 0.0 |
| 1983 | 0.0 | 0.0 | 0.0 | 0.0 | 0.0 | 0.0 | 0.0 | 0.0 | 0.0 | 0.0 | 0.0 |
| 1982 | 0.0 | 0.0 | 0.0 | 0.0 | 0.0 | 0.0 | 0.0 | 0.0 | 0.0 | 0.0 | 0.0 |
Distribution map
Distribution - 2017
This map shows the observed distribution of the Dusky Woodswallow for 2017.
The red circles are the grid cells where Dusky Woodswallow have been reported.
The transparency of the red circles indicate how many surveys sheets were submitted for that grid cell; the darker the red the more reliable the data. Of the 315 grid cells with reports, 83 had only one sheet; an example is grid number E21.
The size of the circle represents the reporting rate. The maximum reporting rate for Dusky Woodswallow was 100.0% (eg grid number E21) and the minimum was 0.1% (eg grid number K15). 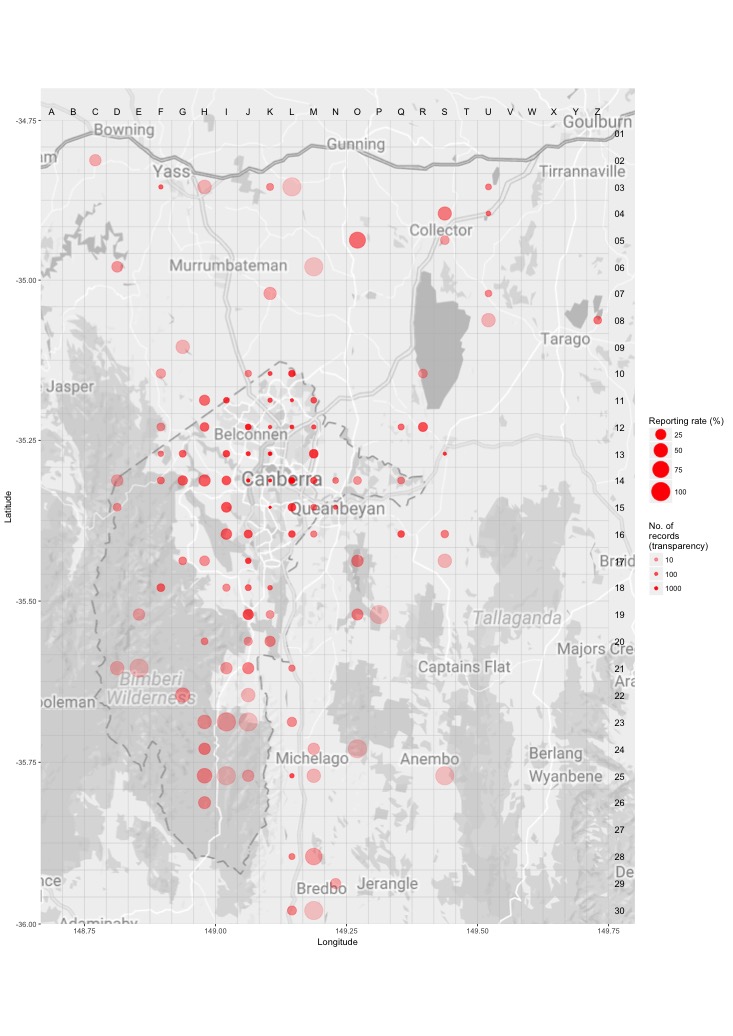
Distribution - all years
This map shows the observed distribution of the Dusky Woodswallow for all years.
The red circles are the grid cells where Dusky Woodswallow have been reported.
The transparency of the red circles indicate how many surveys sheets were submitted for that grid cell; the darker the red the more reliable the data. Of the 703 grid cells with reports, 55 had only one sheet; an example is grid number K29.
The size of the circle represents the reporting rate. The maximum reporting rate for Dusky Woodswallow was 100.0% (eg grid number K29) and the minimum was 0.1% (eg grid number Z1). 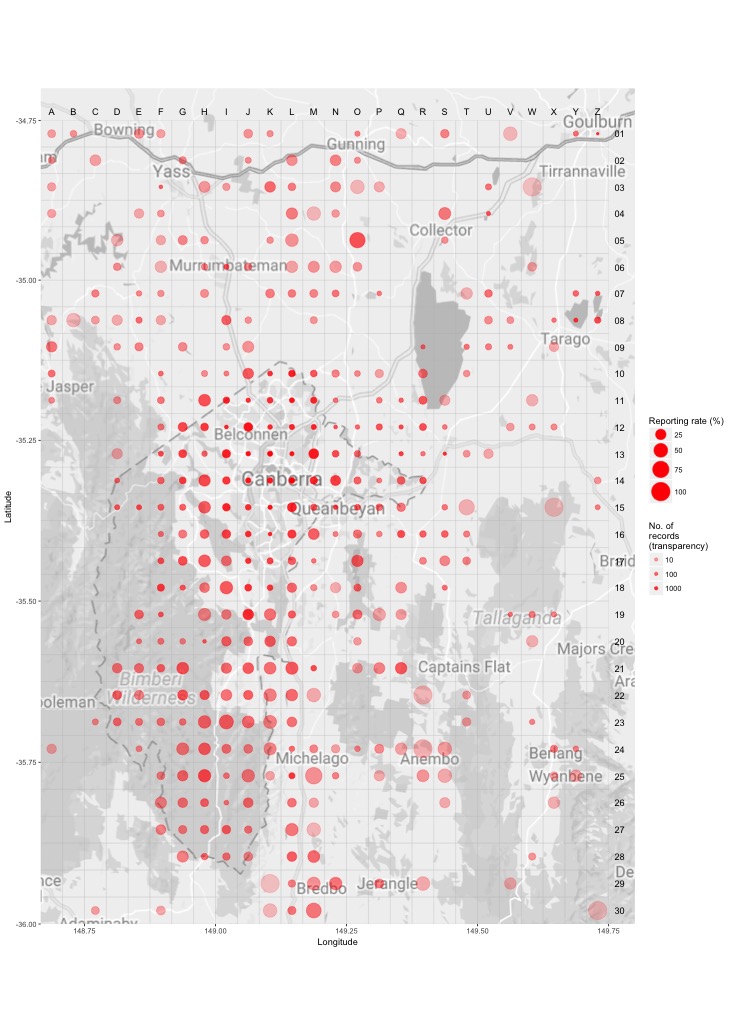
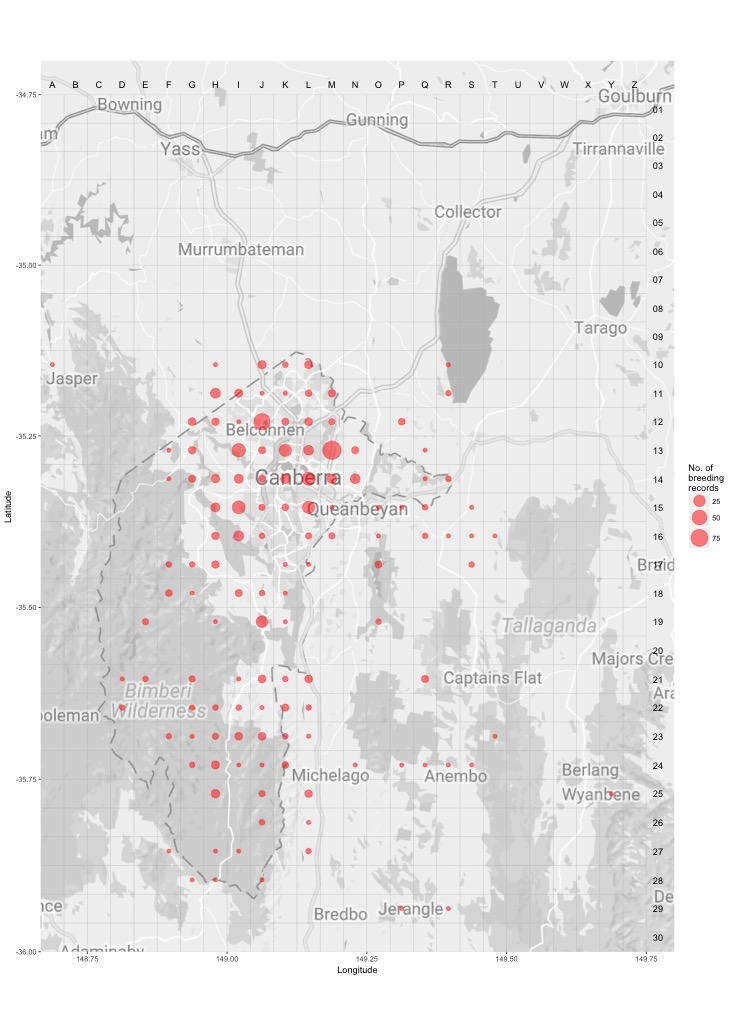
Breeding map
Breeding - 2017
This map shows the breeding distribution of the Dusky Woodswallow for 2017.
The red circles are the grid cells where breeding activity for Dusky Woodswallow have been reported.
The size of the circle represents the number of reports. 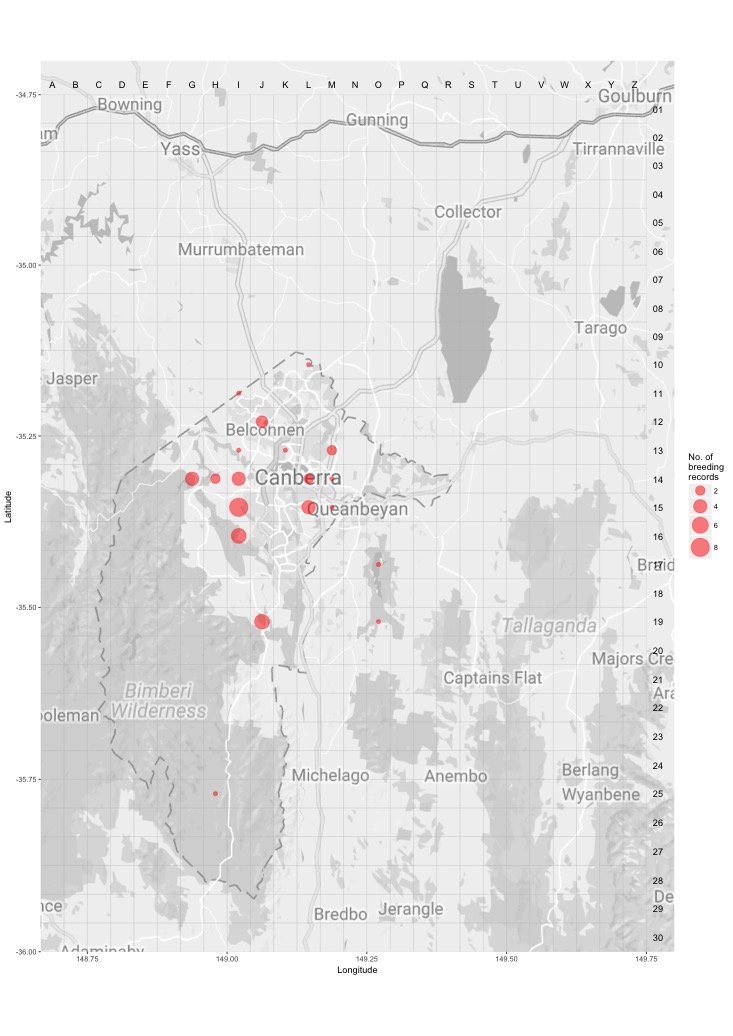
Breeding - all years
This map shows the breeding distribution of the Dusky Woodswallow for all years.
The red circles are the grid cells where breeding activity for Dusky Woodswallow have been reported.
The size of the circle represents the number of reports.